

Work order status breakdown
The Work Orders tab opens with a status breakdown: how many work orders are in each status for the selected date range. Use it to spot bottlenecks — a growing “In Progress” pool or a rising overdue count.
Work order status breakdown chart for the selected date range
Trend charts
Trend charts plot work orders created and completed over time. Watch for:- Created consistently above completed — backlog is growing; consider capacity or triage changes.
- Spikes in created — often a seasonal or equipment-driven event worth investigating in Requests.

Trend chart of work orders created versus completed over time
Completion rates
The completion rate shows what share of work orders were finished within the selected period. Filter the date range to compare weeks or months and confirm process changes are working.Efficiency and productivity
The Efficiency tab focuses on throughput and productivity metrics — how much work the team completes relative to what comes in. The Technicians tab breaks productivity down per person: work orders assigned, completed, and each technician’s workload for the period.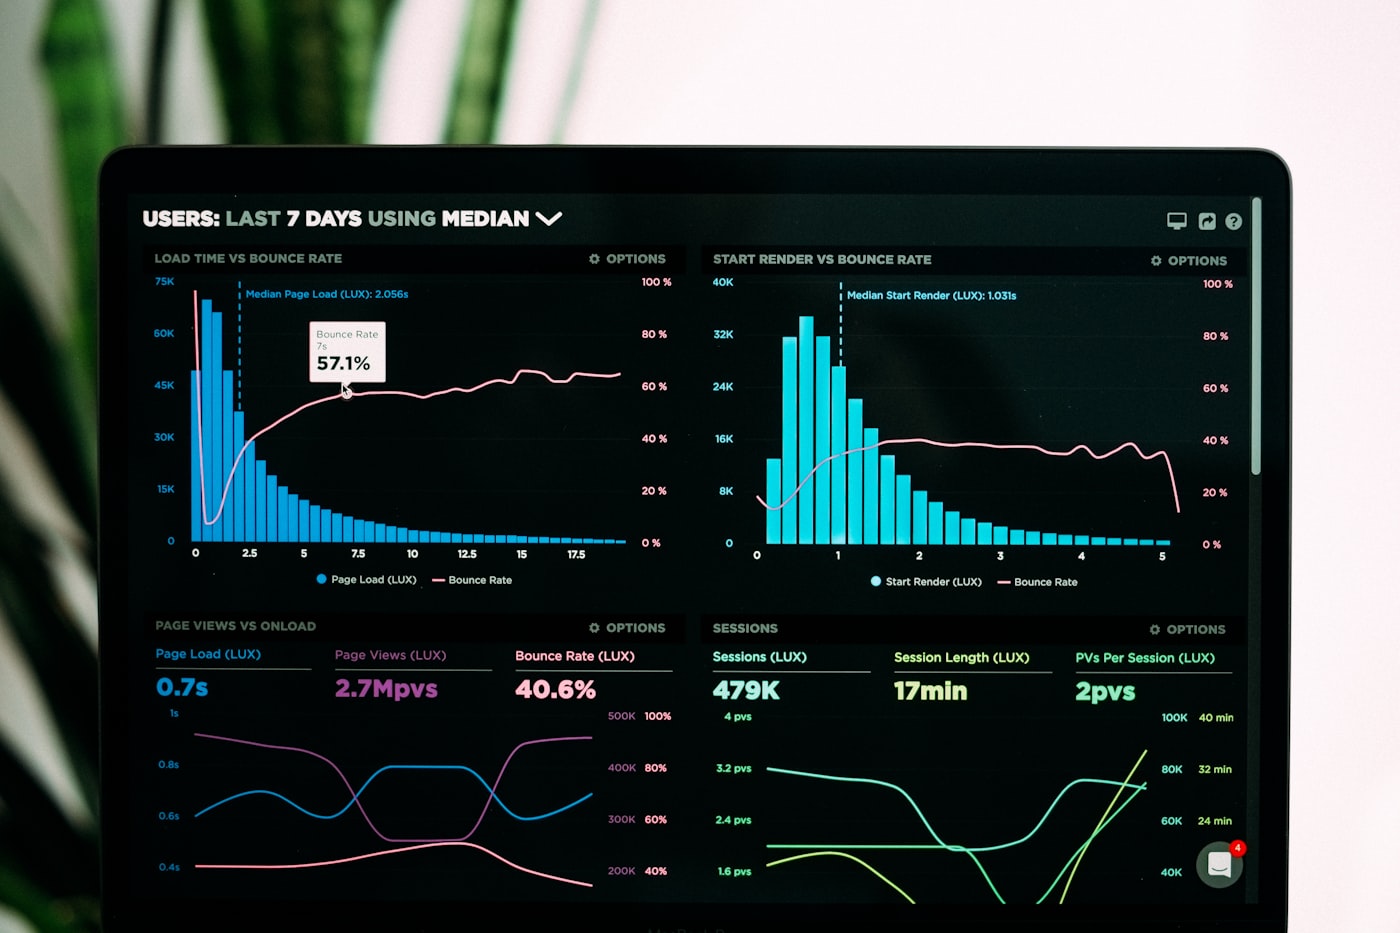
Technician productivity comparison on the Technicians tab
Common questions
Why do my counts change when I change the date range?
Why do my counts change when I change the date range?
All metrics recalculate for the selected range. A work order created in one period and completed in another appears in different metrics depending on the range.
Can I see the work orders behind a number?
Can I see the work orders behind a number?
Yes — drill-down works throughout. Select a chart segment or metric to list the underlying work orders.
Can I get this report automatically?
Can I get this report automatically?
Yes. See Exporting & Scheduling to export or schedule automated reports.